RiskAMP concepts
Distribution Fitting
The RiskAMP Add-in includes a tool for fitting existing data to a random distribution. It can be used to create new data matching an existing series, or for getting a better understanding of your data.

Using the Distribution Fitting Tool
To fit data to a distribution, select your data — in a single contiguous row, column, or array — and then click Fit Data on the Monte Carlo ribbon menu (toolbar). You can change the selection while the dialog is open and you’ll see updated results.
The distribution fitting tool will ignore any empty or non-numeric values in your selection.
Results
The distribution fitting tool can fit data to Normal, Log-normal, Triangular, Uniform, Beta and Beta-PERT distributions. We may add more distributions in the future. If there’s one you need, please let us know.
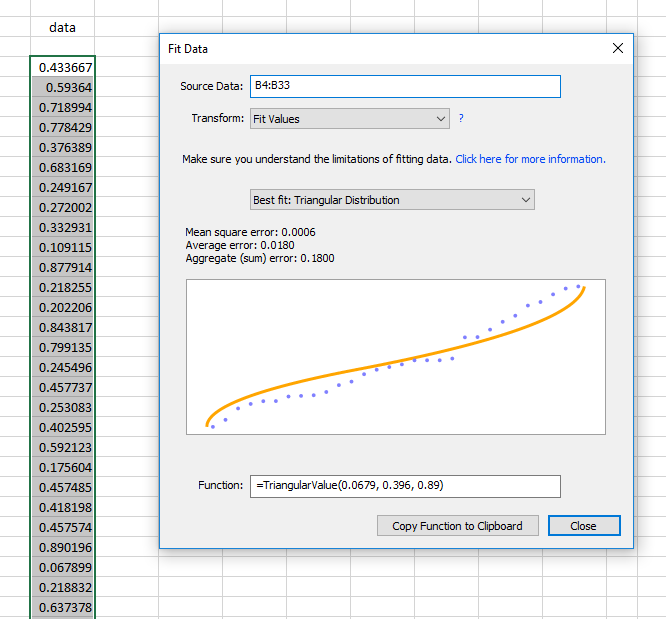
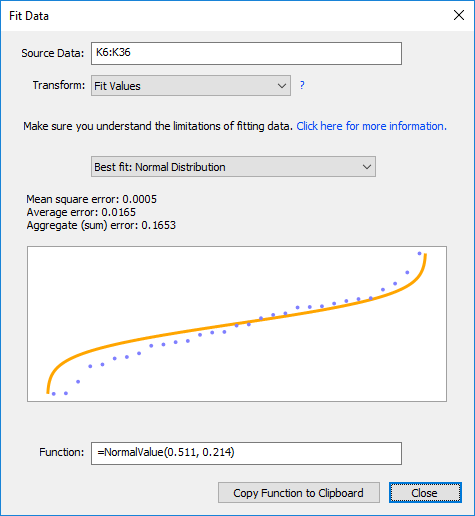
The distribution fitting tool uses a least-squares method and a histogram of the data to find the “best fit”. The rest of the possible distributions are listed in order of likelihood. The chart in the dialog shows your selected data (sorted, and in blue) plotted against the theoretical distribution (orange). The closer the data matches the curve, the better the fit.

It’s really important to understand that distribution fitting is not magic. We can only use the available data to guess at the underlying distribution, and in many (if not most) cases there are roughly equivalent fits to more than one possible distribution.
The more data you have, the better the fit will be, and the easier it will be to focus on a single distribution.
The distribution fitting tool will create a formula, using the RiskAMP random distribution functions, to model the candidate distribution. You can copy this formula and paste it into your spreadsheet.
In most cases, even after selecting a candidate distribution, you may still want to make some adjustments to the distribution parameters.
Selecting a Distribution
In some cases it may be easy to select a candidate distribution. In other cases there may be more than one reasonable choice. Some things to consider when selecting a distribution are:
- Do you expect the data to be bounded or unbounded?
The normal and log-normal distributions are unbounded. That means most values will fall within a predictable range, but there is always the possibility of an extreme value far outside the usual range.
The triangular and uniform distributions, on the other hand, are bounded — you will never see a value beyond the given limits.
- Is your data symmetrical or asymmetrical?
The normal distribution and the uniform distribution are symmetrical — there will be an equal number of values on both sides of the mean (average) value.
The log-normal distribution is asymmetrical — values are heavily tilted to the positive side.
The triangular distribution can be either symmetrical or asymmetrical, depending on the parameters. When the distribution fitting tool models the triangular distribution, it will select parameters based on your data, so it will reflect the symmetry (or lack thereof) in your data.
Transforming Data
If you have data in a series, you can fit the rate of change instead of the raw value.
For example, it is commonly argued that changes in the price of a security over time are lognormally-distributed (we don’t specifically endorse or reject this view). In this model the change in the security price is important, not the actual price.
You can use the distribution fitting tool to model changes in series data. Set the Transform option in the Fitting dialog to Rate of Change.
For example, if your data consists of the following prices in series:
We will take the quotient of the values, using
Where 1.117 is 89.35 / 80.00, and so on.
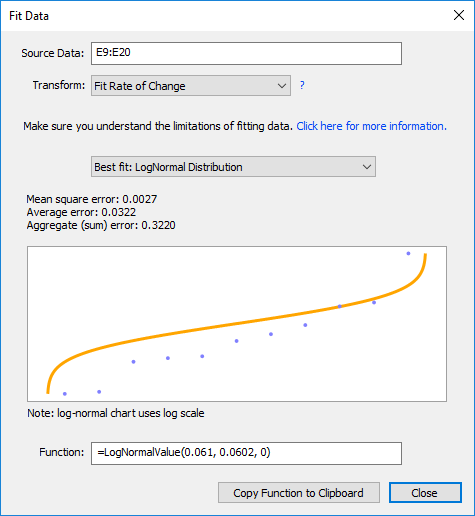
The distribution fitting tool models this to a lognormal distribution with (approximately) mean of 0.06 and standard deviation of 0.06 (although this sample is far too small for a reliable fit). This would correspond to an average expected return of 6% and a standard deviation of 6%.

Note that modeling rate of change will reduce the number of samples by 1, because we are taking the quotient of every pair of values.