Powerful tools for risk analysis & modeling
RiskAMP is a full-featured Monte Carlo Simulation Engine for Microsoft Excel®. Understand risk and get insights into your data with stochastic analysis.
Learn more
What is Monte Carlo simulation?
When you build a model of something in the real world — a stock portfolio, a project plan, a clinical trial — you have to build in assumptions about the future. You pick some values for your expected stock returns, for example, and project them into the future.
But the real world doesn't work that way. Stocks go up, and they go down. Projects run over time or under budget.
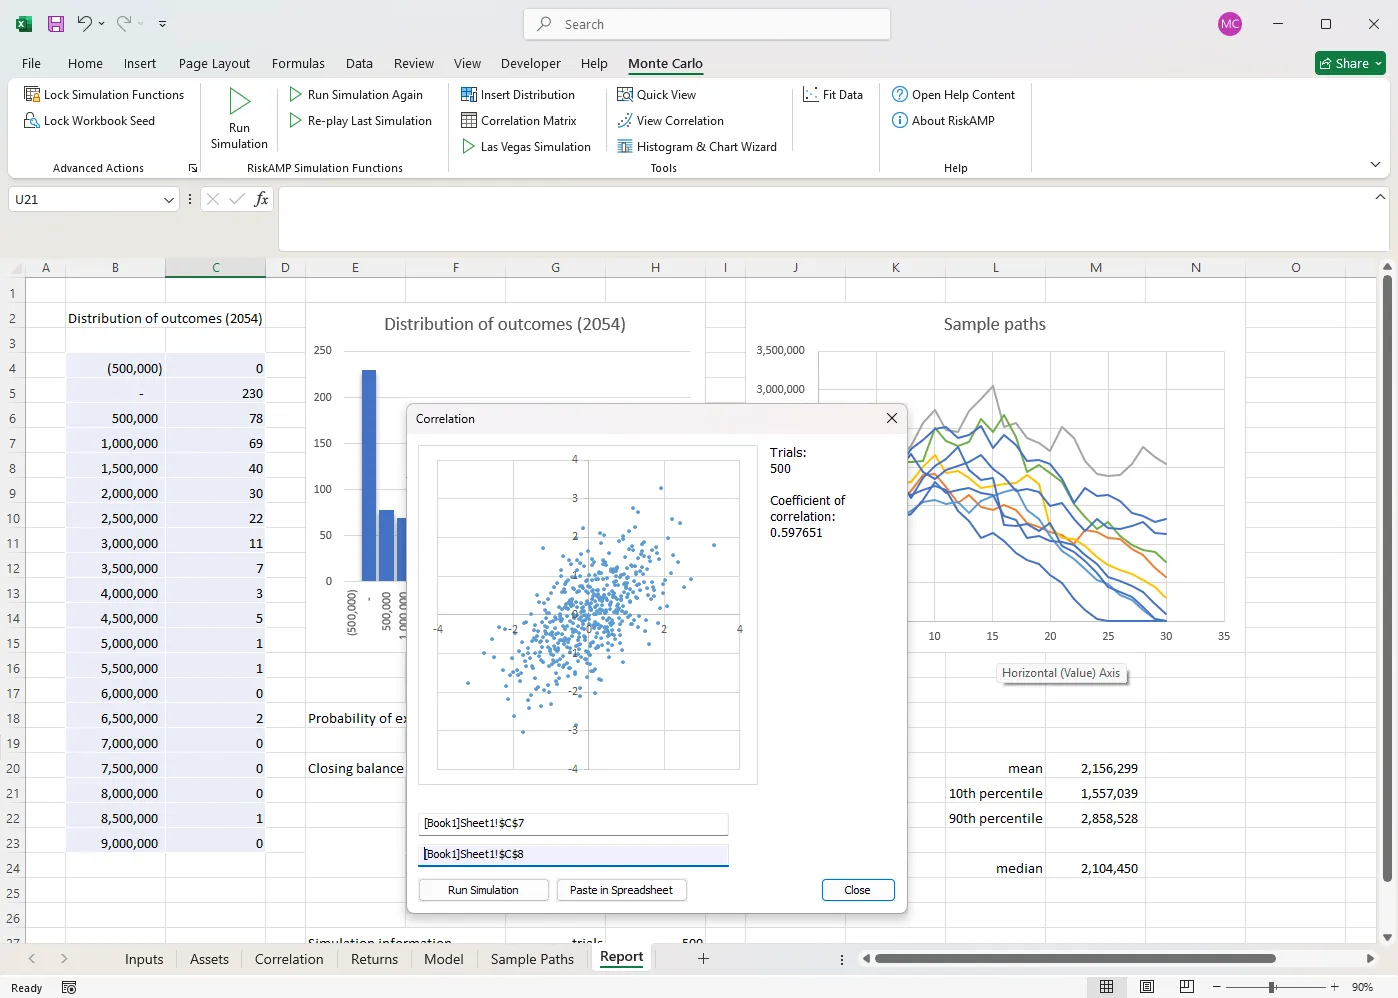
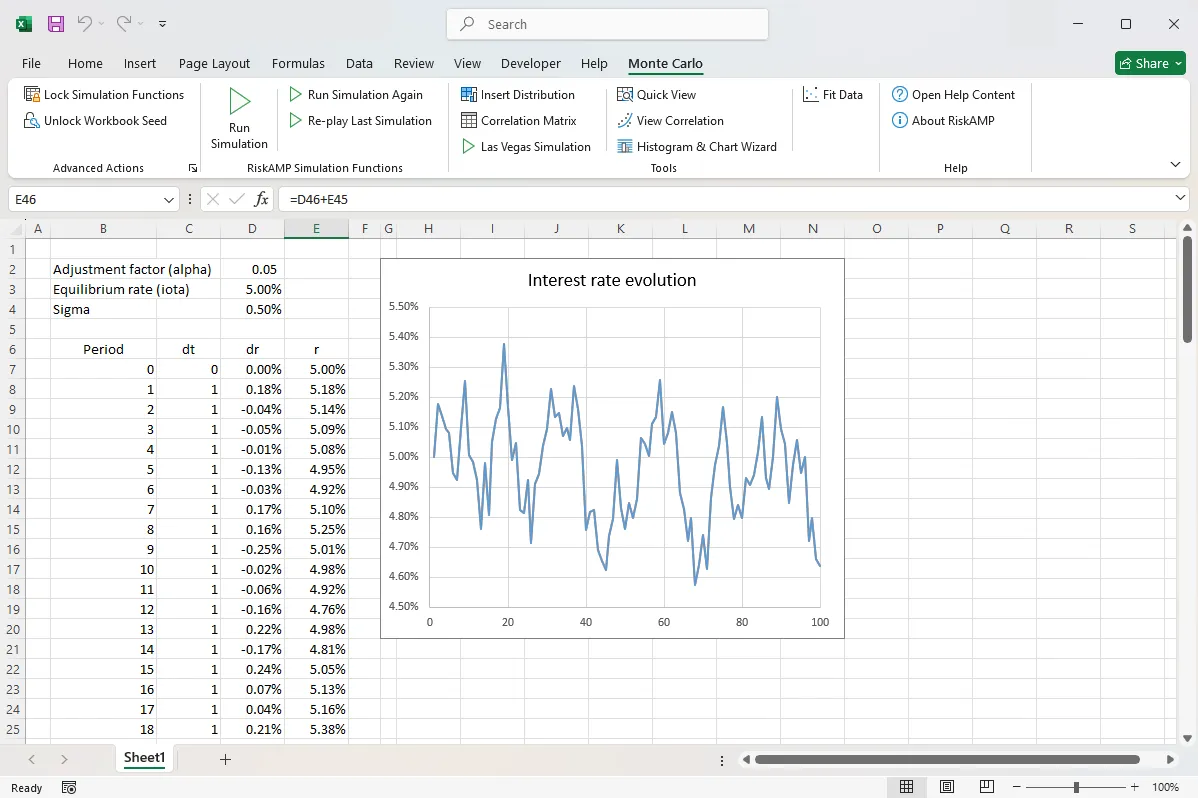
Monte Carlo simulation is a way to build this variability into your models. Instead of saying this stock will return X% every year, you can say things like this stock will return between X% and Y%; and then figure out what that means to your portfolio.
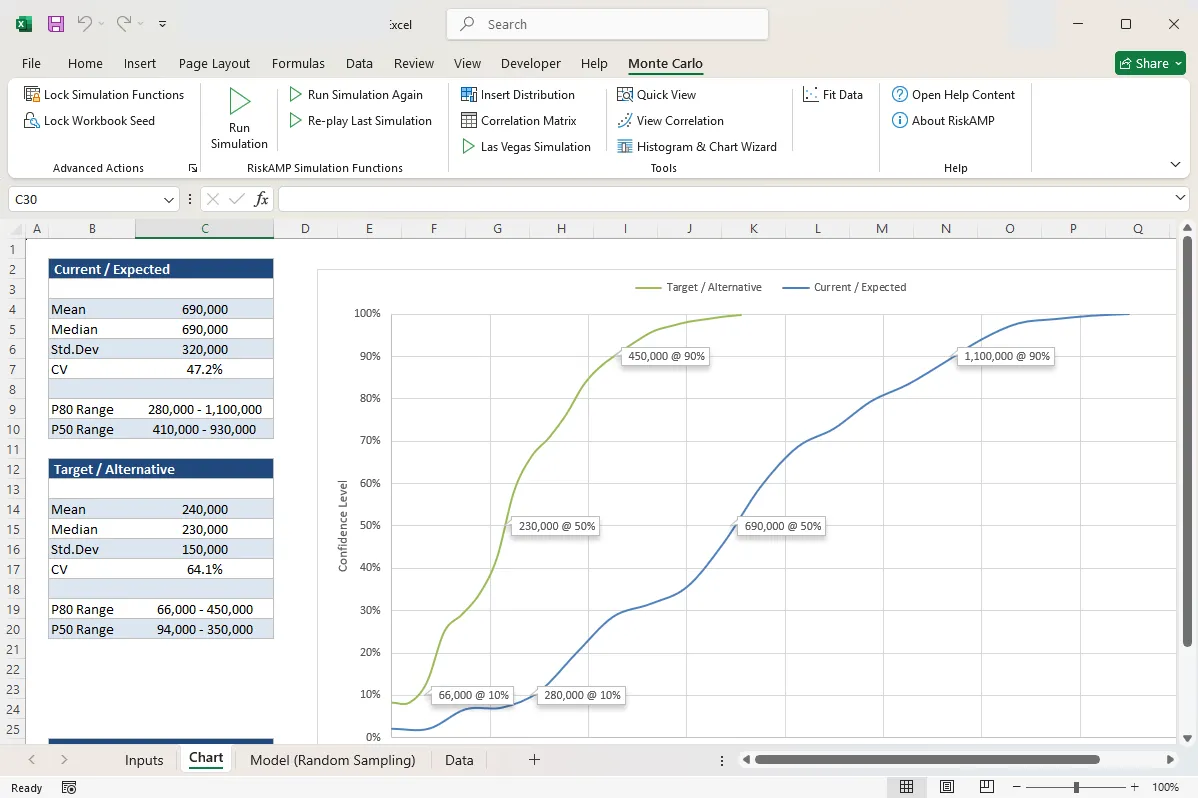
Once you have that variability in your model, you can start to understand the risk in your model. What is the likelihood that you will lose money? What is the probability that the project will run more than a year late?
Step-by-step
How does it work?
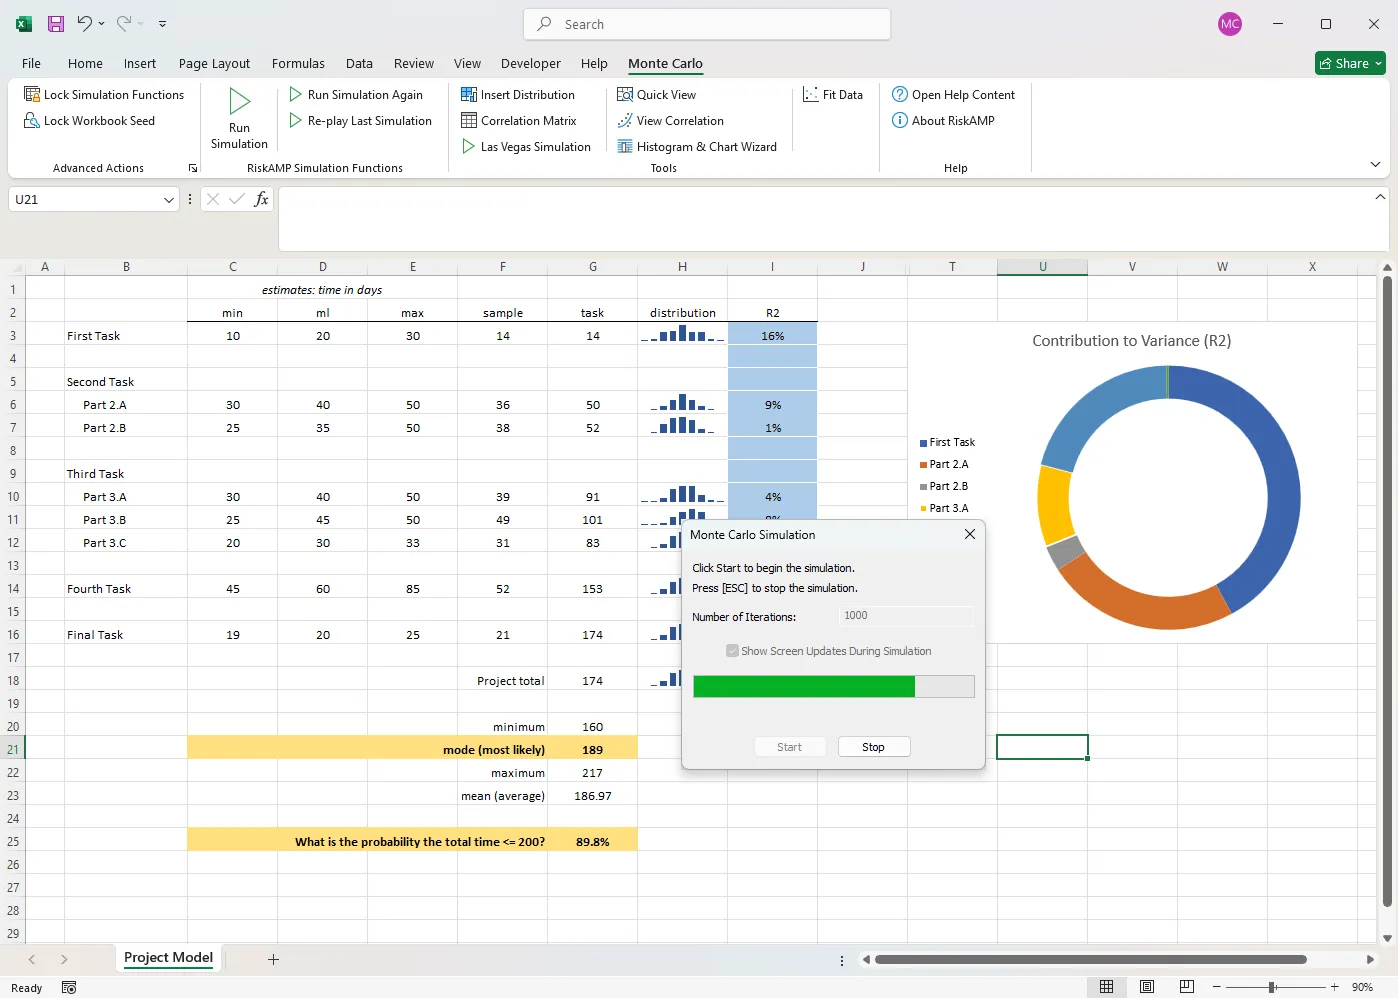
There are three key steps to using Monte Carlo analysis. First, we replace fixed values in the model – things like expected stock prices and projected project costs – with random variables. We are adding randomness, or stochasticity, to the model.
Once that's done, the second step is running a simulation: we recalculate the model hundreds or thousands of times, each time changing the random values. We are simulating the real world where values change randomly.
The last step is analyzing the results of the model, by looking at the hundreds or thousands of results from the simulation. We use statistical analysis to derive information from the distribution of those results.
For example, we might run a stock portfolio through the simulation process. Then we can look at the results and say "in 25% of the cases, the portfolio lost money". Or "in 75% of the cases, the portfolio outperformed the market.
Features & value
Why RiskAMP?
The RiskAMP Add-In for Excel offers the best combination of features and low price — it's the best value in Monte Carlo simulation software.
But don't take our word for it: we offer a free trial version, as well as an unconditional 30-day money back guarantee.
The RiskAMP Add-in makes it easy to get started, with point-and-click tools for creating random distributions and generating charts and graphs. Once you get more comfortable with it, you can use the full set of Excel functions to design more complex and more insightful analytical models.
- More than 40 random distribution functions including the PERT distriubution for cost and project modeling and correlated multivariate distributions.
- 20 statistical analysis functions for building analytical models from the simulation, including one-function histograms.
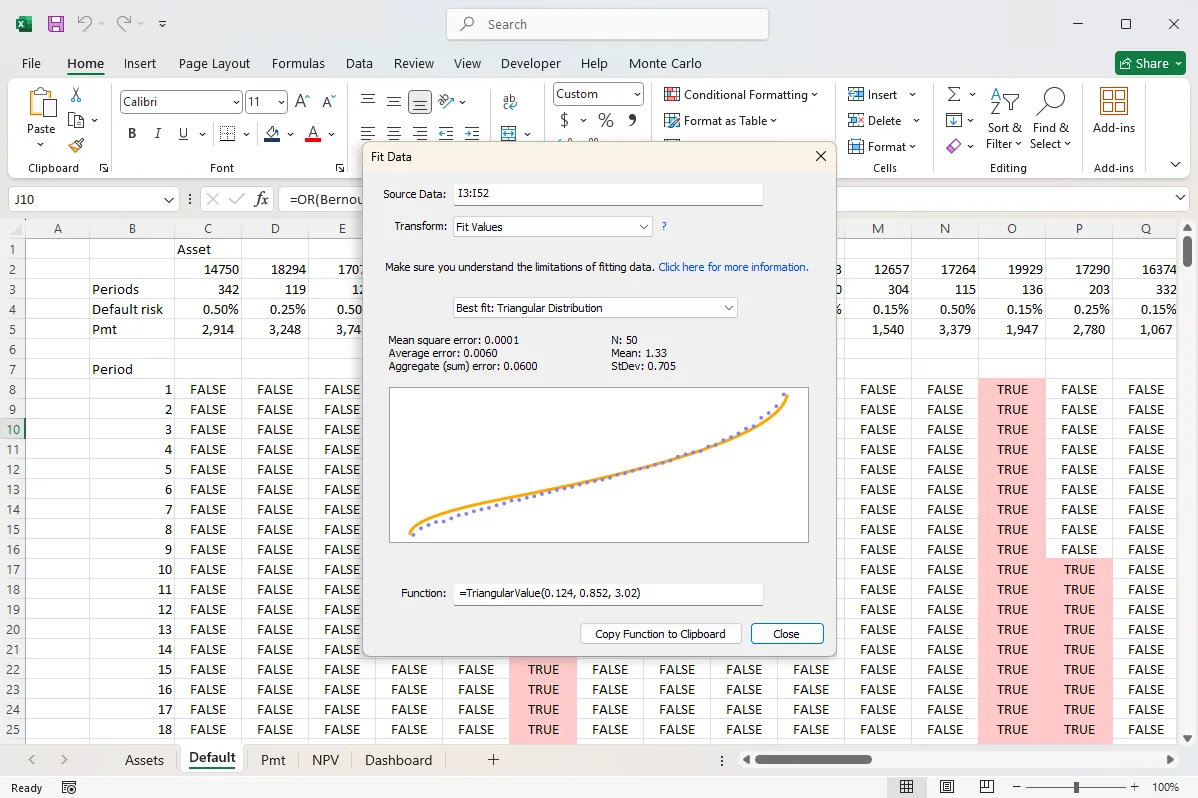
- Latin hypercube sampling, distribution fitting, las vegas simulation, and more: click here for a full list of features.
And we are always available to help you design and build your spreadsheets to get the most our of your analysis.
Download a Free Trial version of the RiskAMP Add-in
Zero-install web version
Want to see how it works, without installing? Try our web platform, RiskAMP web. It's a browser-based spreadsheet and it includes all the RiskAMP random distribution & statistical analysis functions.